
Data Management, Analysis and Visualisation
Each node of the APPF offers unique software capabilities
Our multi-disciplinary team offers the full scope of data management, from statistically designed layouts at the outset through to visualisation tools on completion – all to maximise your results. We can support your research through:
- Consultation – on best practice protocols, project design and statistical layout.
- Analysis – of images, preparation of growth curves, and access to datasets and visualisations tools.
- Bioinformatics and biometry – by performing quality control processes on datasets, providing standard data analysis, provision of open source algorithms and access to analytical pipelines, and by assisting researchers to process and interpret complex data.
- Data management – including data storage and access to data sharing tools.
- Education and training – in plant phenomics, image analysis, bioinformatics, biometry and statistical design.


TPA® Tools
TPA® Tools
Real-time image & data analysis.Learn more
TraitCapture
A “seeds to traits” pipeline allowing users to track genotype selection, set growth conditions and analyse phenotypic variation.
TraitCapture
TraitCapture is a “seeds to traits” pipeline which allows users to track seed/genotype selection, set growth conditions, and analyse phenotypic variation for heritable components through to mapping causative loci via GWAS and QTL analysis. Web-based visualisation tools allow real-time graphing of environment data with associated plant growth in time-lapse. Cloud-enabled GWAS on plant growth variation can be performed during an experiment allowing for real time capturing of heritable traits and trait loci across environments. This feedback allows users to tune the environments, phenotyping protocols and image analysis to improve QTL detection. When QTL are identified, a user can re-sort plants based on alternative genotype classes to look for pleiotropic effects on growth, development, and physiology. Experiments enabled by TraitCapture include:
- Iterative QTL identification and tests of pleiotropy.
- Heritability of potential spectral indices using hyperspectral cameras.
- Spatial and temporal distribution of fluorescent pigments under environmental stress.
- Light and temperature interactions on transpiration using Infrared (IR) cameras.
- Genetic basis of photosynthetic activity and efficiency using chlorophyll fluorescence cameras.
- Integration of 2.5D and 3D quantification of plant growth with stereo imaging.
For more information contact APPF (Canberra, ANU).

TPA® Tools
Access your images and analyse your data in real time on a daily basis using TPA® Tools.
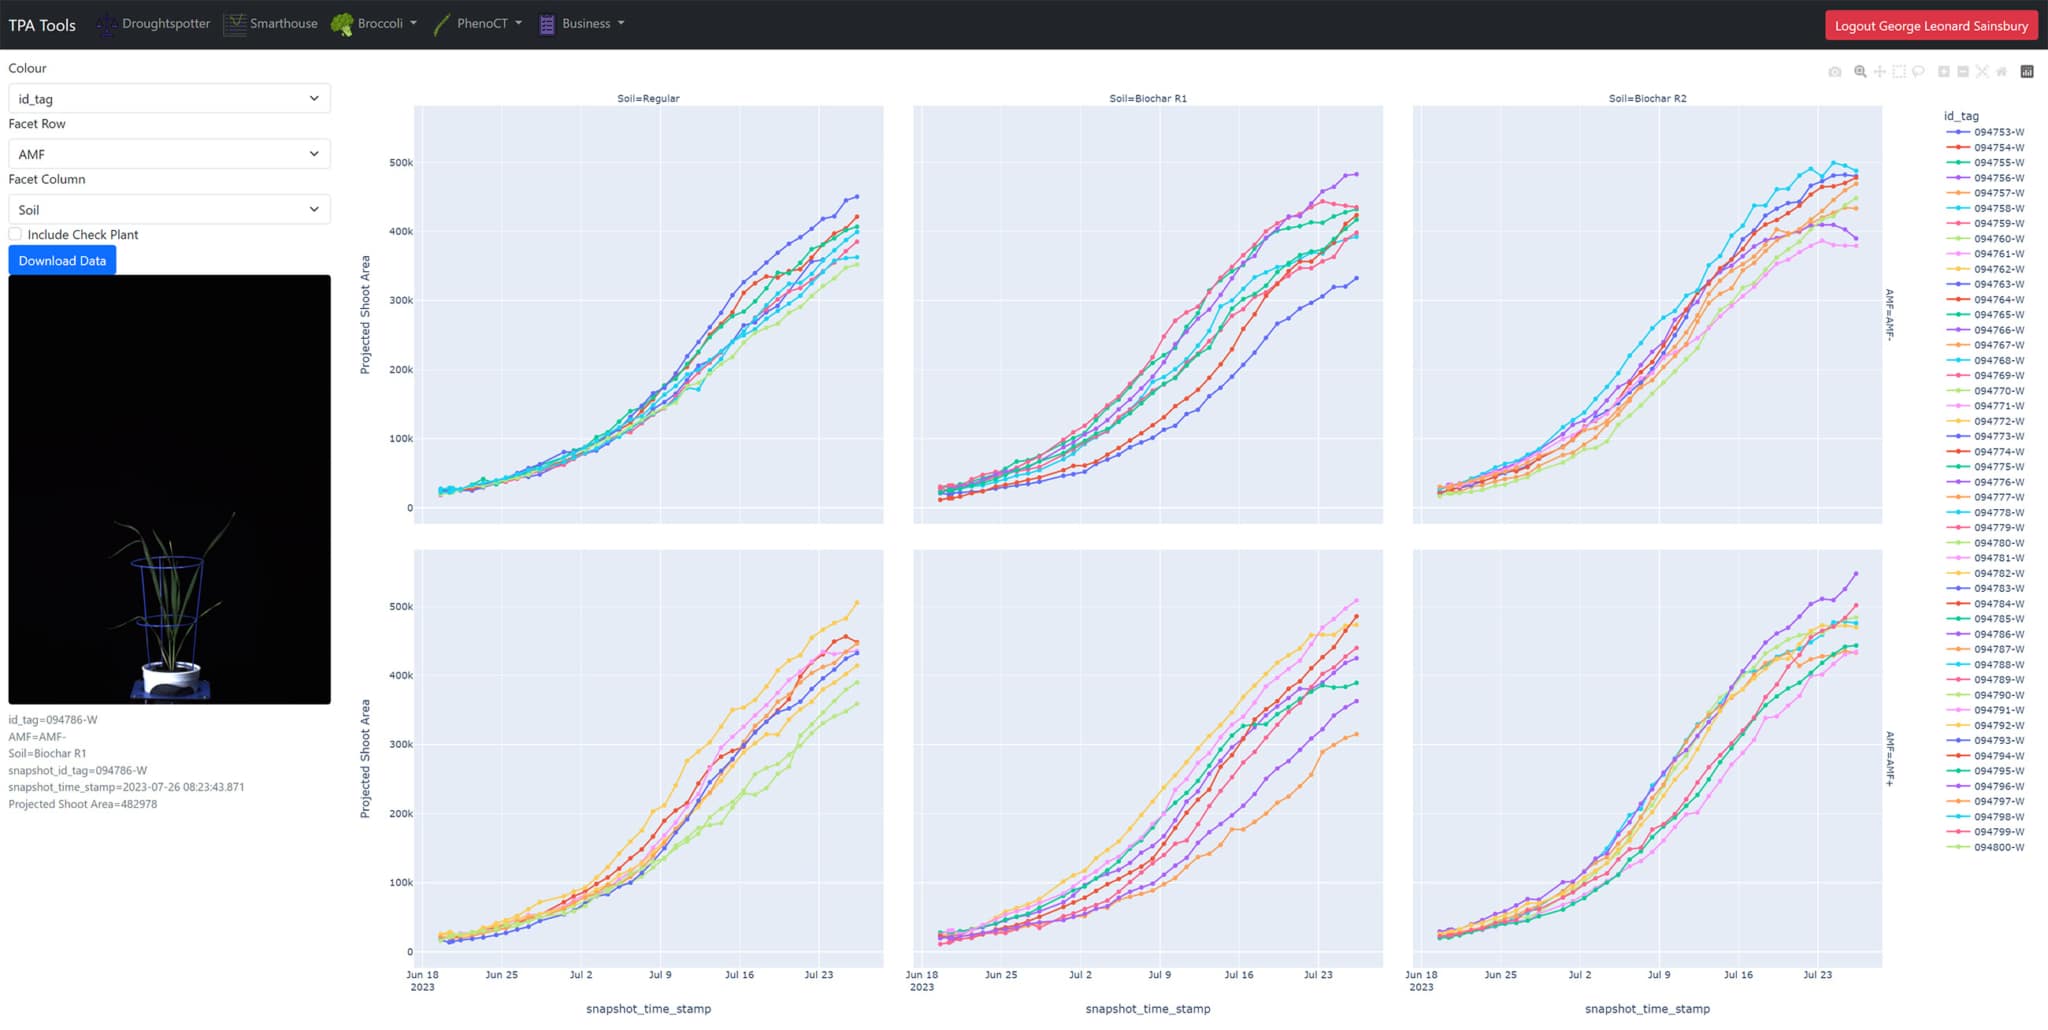
TPA® Tools
Researchers undertaking experiments at the APPF’s Adelaide node are able to access their images and analyse their data in real time on a daily basis using TPA® Tools. TPA® Tools is a web application suite which allows users to plot data and download images from their experiments.
With daily access to the incoming preliminary data, researchers can enjoy greater control over their experiments, introduce early intervention and modifications to experimental protocol if required, run a preliminary analysis before having a view of the full experiment and even monitor progress when not onsite.
TPA® Tools is designed to help us share our data with all researchers. We use TPA® Tools to link the experimental metadata, such as genotypes and treatments, with the image data. We then interface directly with our results database, process the data and make it available to the user via a private login on the web.
Watch the video here to learn more and view a tutorial. For more information contact APPF (Adelaide).
Data sharing and R packages
We are passionate about plant science and promote the open sharing of data to accelerate research.
Open data sharing
APPF policy promotes open data sharing. All APPF data is published online for reuse and developed algorithms are shared in open source environments.
Linking of phenomics information with the APPF’s modelling capabilities, TERN data, Bureau of Meteorology’s climatic data and Geoscience Australia’s DataCube will provide forecasting products on the Cloud for predicting agricultural productivity and the impact of various scenarios.
R packages
Our statistical workhorse is ASReml-R, the R-language implementation of the ASReml statistical software package (proprietary). R users can access it as the asreml package, but will require a software licence.
The Australian Plant Phenomics Facility supplements ASReml with three R packages written by Dr Chris Brien (APPF Adelaide node):
- asremlPlus – extra functionality for asreml
- dae – software for designing and analysing experiments
- growthPheno – software for smoothing and extracting traits from phenotypic growth data
These 3 packages can be downloaded freely from CRAN or from Chris’s website.
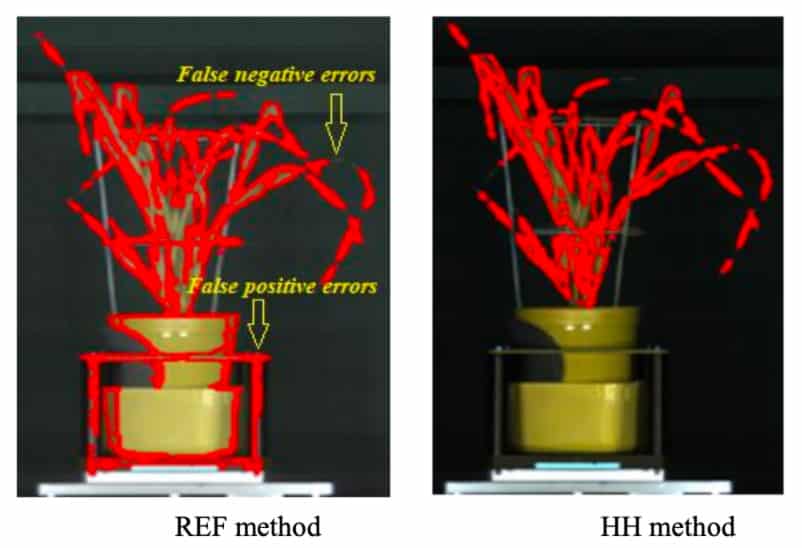
Green plant segmentation tool for hyperspectral images
Green plant segmentation plays an important role in hyperspectral-based plant phenotyping. Existing image segmentation methods are dependent on data types, plants and backgrounds, and might not utilise the power of hyperspectral data. A team from the APPF’s Adelaide node have developed a one-class support vector machine classifier combined with a pre-processing method named ‘hyper-hue’ to segment green plant pixels in hyperspectral images. Experimental results showed that this method out performed the approaches using vegetation indices or SVM only. The model was trained using the data of wheat and worked equally well for other species. The modelling method was suitable for both VNIR and SWIR data. In the future, this green plant segmentation method will be further tested using data collected in the field, such as on aircraft or ground-based vehicles.
The hyper-hue algorithm is free to download here or here.
Read the background on the hyper-hue algorithm here.