

The Australian Plant Phenomics Facility is partnering with fellow NCRIS-enabled infrastructure TERN to significantly upgrade TERN’s nation-wide network of time-lapse cameras that monitor the timing of vegetation development, including flowering, fruiting, and leaf lifecycle—phenology—and provide vital information on our changing ecosystems and their services.
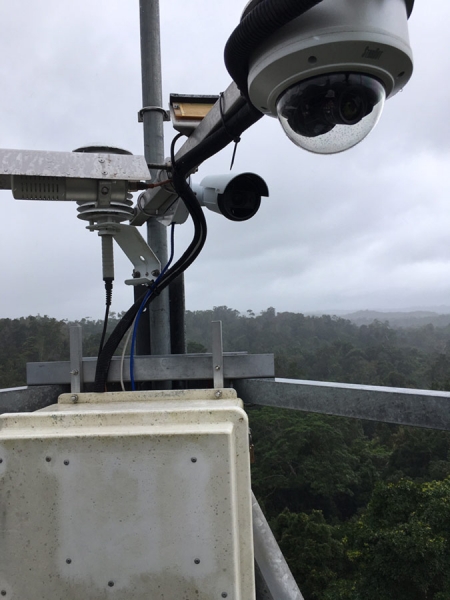
Over the next year, a new network of phenology monitoring cameras—or phenocams—will be installed at 12 of TERN’s ecosystem observation SuperSites. This enhanced nation-wide network of cameras will collect repeat digital photographic images of vegetation to help scientists monitor the direction and magnitude of changes in phenology due to climate change and extreme weather events, such as cyclones and droughts.
TERN will install phenocams on its eddy-covariance flux towers and on the ground to deliver a stream of photographic data at 30 minute intervals during daylight hours of canopy and understorey vegetation change.
The time-series data will flow to a central platform developed collaboratively by TERN and the Australian Plant Phenomics Facility (APPF) for storage and processing into a number of in-demand products for the research community, including a ‘greenness’ index and one and three-day data products as per protocols developed by the US PhenoCam Network. Both raw image data and analysed data products will be made available via TERN data portals.
Data to crack really serious environmental issues
Together, TERN and the APPF are set to make phenology big data openly-accessible to scientists studying ecological responses to climate change, climate variability and extreme weather such as heatwaves. Dr Caitlin Moore of the University of Illinois, the author of a 2016 synthesis paper on the value of phenocams, says:
“Phenocams enabled us to pick up on smaller scale phenology changes otherwise missed by the larger scale remote sensing approach. Whilst remote sensing provides a useful tool for characterising broad phenological diversity over the continent of Australia, phenocams provide a more detailed insight into site-specific changes that are not captured by remote sensing indices. For example, phenocams were able to capture individual tree canopy defoliation and flushing events in the Daintree rainforest, which is otherwise regarded as consistently evergreen.”
Time-series images of vegetation are also vital for phenological model validation and development, calibration and validation of satellite derived phenology and other remote sensing products and studies of climate change impacts on terrestrial ecosystems. For example, on-ground phenocam data are vital for the calibration and validation of TERN’s Australian Phenology Product, which is used by researchers and governmental agencies around Australia.
One such researcher is Professor Alfredo Huete of University of Technology Sydney (UTS), who’s using the TERN Australian Phenology Product together with phenocam data and pollen monitors to track grass pollen sources, their evolution and impact areas. The forecasts generated by Alfredo and his team will help alleviate Australia’s $30B medical and socioeconomic allergy burden and change the lives of millions of Australians for the better.
Dr Tim Brown, Director of the APPF’s ANU node, helped TERN launch the Australian Phenocam Network in 2014 after collaborating with similar networks in North America and Europe. Tim’s team at the APPF is using gaming technology and the large amounts of data now available from drone flights, sensors and phenocams to merge digital data with the real world to create virtual versions of forest field sites.
This has wide applications both in the lab and field and for education. In the field it enables researchers or the public to see otherwise hidden virtual data mapped onto real trees in a research forest, and in the lab or an educational context, it enables people to visit a virtual model of a real world ecosystem and to watch the trees grow or see seasonal temperature changes mapped onto the landscape.
“It’s a bit like Star Trek. Researchers walking through a forest could use a tablet or augmented reality to view sensor data layered onto the actual trees. This complexity of data is needed to crack really serious environmental issues. However, until recently it was hard to use these new technologies well unless you were a total geek. You get a huge pile of data that can be really hard to make sense of.”

- The enhanced TERN phenocam network is expected to be operational by June 2020. In the meantime, you can access gigabytes of phenocam-collected images from already established phenocams by contacting esupport@tern.org.au.
- TERN currently has functioning phenocams at the following sites:
- Calperum Mallee SuperSite
- Litchfield Savanna SuperSite
- Tumbarumba Wet Eucalypt SuperSite
- Warra Tall Eucalypt SuperSite
- Alice Mulga SuperSite (images to 2017)
- TERN also has phenocam data collected from partner institution phenocams from these sites:
- Wombat Stringy Bark Eucalypt SuperSite
- Samford Peri-Urban (Affiliate) SuperSite (images to 2016)
- Cumberland Plain SuperSite (images to 2014)
- Whroo Dry Eucalypt (Affiliate) SuperSite (images to 2015)
- For more information on this project, contact TERN’s Dr Mirko Karan or the APPF’s Dr Tim Brown.
Mark Grant, TERN