

In a recent paper, researchers have developed a methodology suitable for analysing the growth curves of a large number of plants from multiple families. The corrected curves accurately account for the spatial and temporal variations among plants that are inherent to high-throughput experiments.
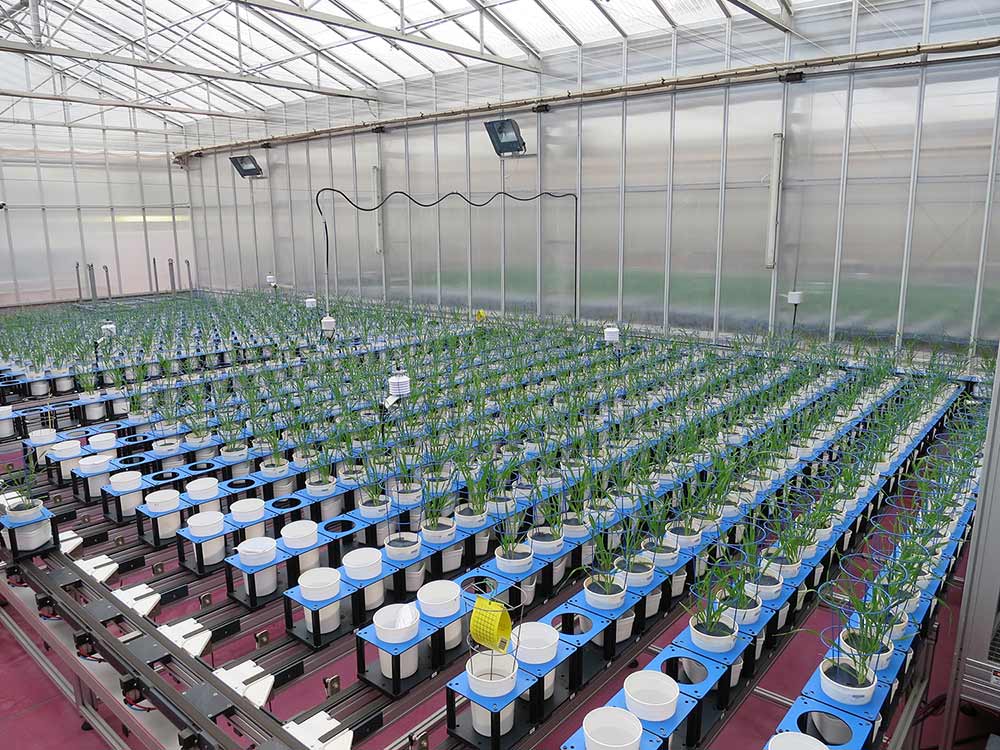
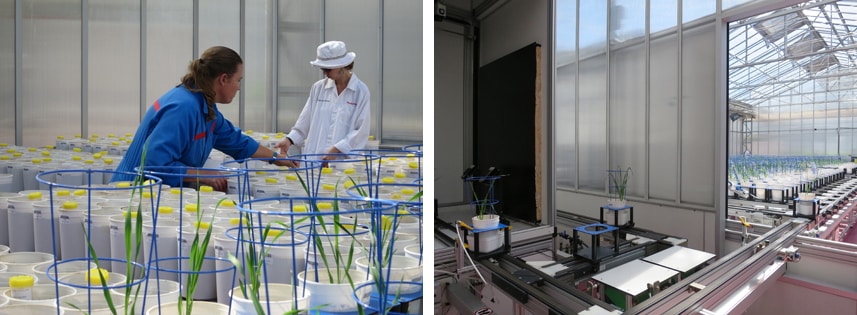
Advanced high-throughput technologies and equipment allow the collection of large and reliable data sets related to plant growth. These data sets allow us to explore salt tolerance in plants with sophisticated statistical tools.
As agricultural soils become more saline, analysis of salinity tolerance in plants is necessary for our understanding of plant growth and crop productivity under saline conditions. Generally, high salinity has a negative effect on plant growth, causing decreases in productivity. The response of plants to soil salinity is dynamic, therefore requiring the analysis of growth over time to identify lines with beneficial traits.
In this paper the researchers, led by KAUST and including Dr Bettina Berger and Dr Chris Brien from the Australian Plant Phenomics Facility (APPF), use a functional data analysis approach to study the effects of salinity on growth patterns of barley grown in the high-throughput phenotyping platform at the APPF. The method presented is suitable to reduce the noise in large-scale data sets and thereby increases the precision with which salinity tolerance can be measured.
Read the full paper, “Growth curve registration for evaluating salinity tolerance in barley” (DOI: 10.1186/s13007-017-0165-7) here.
Find out how the Australian Plant Phenomics Facility can support your plant science research here.